SCROLL DOWN
TAP TO
EXPLORE
Autonomous Alerts
Rich, actionable alerts that "just work". No setup required. Get notified — but only when it matters.
Conversational Debugging
Interrogate your app in plain language. Stop digging through mountains of telemetry. Ask questions, get answers.
Coding Agents Welcome
Claude Code, Codex, Cursor — whatever. Sazabi integrates tightly with all major coding agents.
Intake: Kinesis Publish Timeout
Impact▶
The intake service is experiencing high error rates while attempting to publish logs to Kinesis.
Root cause▶
Kinesis shard throughput limit exceeded due to a spike in log volume from the intake service.
Recommended action▶
Scale up the Kinesis stream shard count and add retry backoff to the intake publisher.
log-inapi lambdaapi lambda. You can track it here: cursor.com/agents/bc-8a1c07afAutonomous Alerts
Rich, actionable alerts that "just work". No setup required. Get notified — but only when it matters.
Conversational Debugging
Interrogate your app in plain language. Stop digging through mountains of telemetry. Ask questions, get answers.
Coding Agents Welcome
Claude Code, Codex, Cursor — whatever. Sazabi integrates tightly with all major coding agents.
Intake: Kinesis Publish Timeout
Impact▶
The intake service is experiencing high error rates while attempting to publish logs to Kinesis.
Root cause▶
Kinesis shard throughput limit exceeded due to a spike in log volume from the intake service.
Recommended action▶
Scale up the Kinesis stream shard count and add retry backoff to the intake publisher.
log-inapi lambdaapi lambda. You can track it here: cursor.com/agents/bc-8a1c07afREADY FOR ACTION
Traditional observability tools make you work for answers. Sazabi works for you — anticipating needs, surfacing insights, and eliminating busywork.
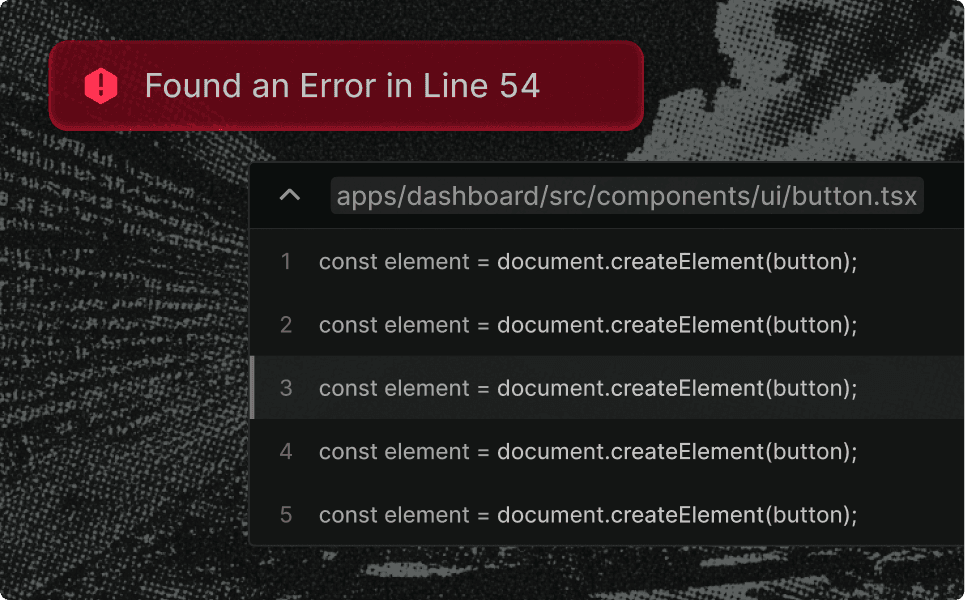
Code Search
From alert to root cause in seconds. Sazabi pinpoints the exact file, commit, or line of code responsible for any issue — no guessing, no git blame deep-dives.
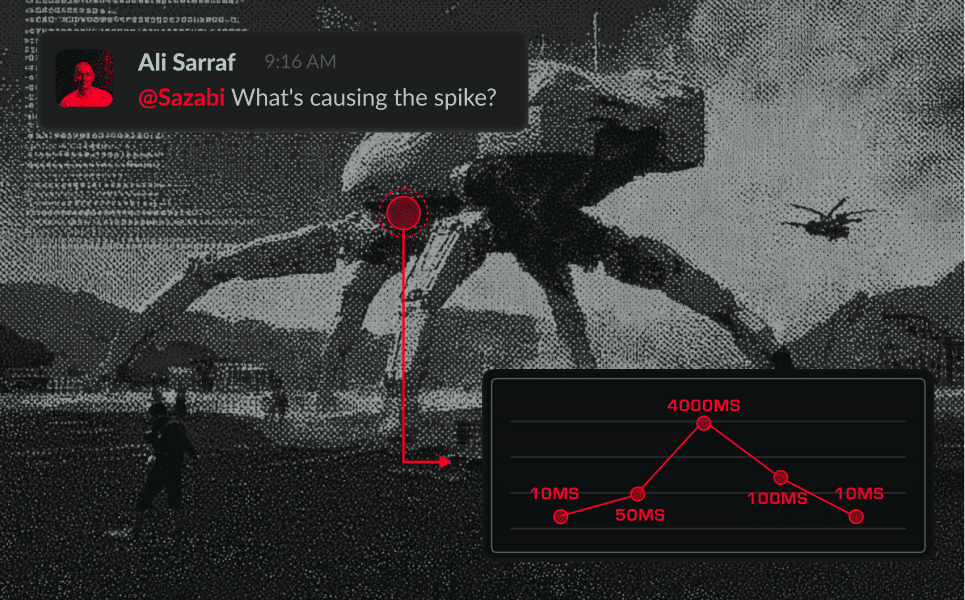
Dynamic Visualizations
Don't get lost in dashboards. Sazabi generates charts, tables, diagrams, and code blocks on the fly. Exactly what you need to see — and nothing more.
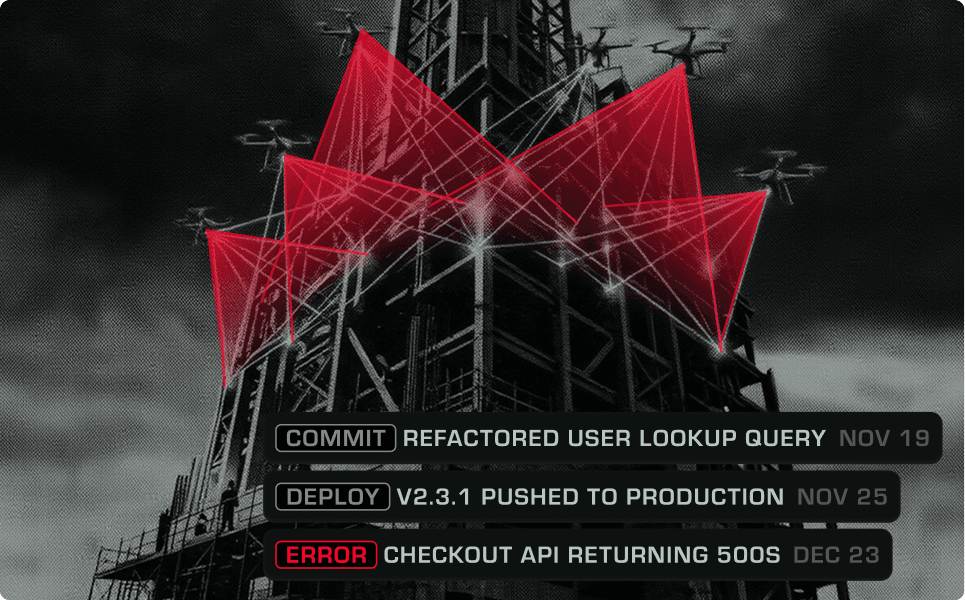
Perfect Memory
Always watching. Always learning. Past incidents and traffic patterns become institutional memory — no manual work required.
INSTRUMENT IN MINUTES
One platform, dozens of data sources. Send logs in any format from any cloud, platform, or technology. With Sazabi, instrumentation is effortless — not invasive.
WORKS WITH YOUR APPS
Observability that works where you do. Sazabi connects to your tools — so alerts, debugging, and incident response happen in the flow of work, not outside it.
MANIFESTO
Sazabi is more than a tool — it's a philosophy. We're taking a radically different approach to observability.


Less is more
Observability platforms have accumulated hundreds of features over the past decade. None of it makes systems more reliable. If observability is about answering questions, the best interface is chat — not dashboards, not config files, not training manuals.
BACKED BY BUILDERS

BULLETPROOF SECURITY
Ask your stack what's broken, slow, or acting weird, in plain language. The system correlates logs, metrics, and traces to answer back with causes.


- SOC 2 certification
- SOC 1 certification
- ISO 27017 certification
- ISO 27001 certification
- GDPR certification
Data residency controls
Choose your storage region and data center. Meet data sovereignty requirements and ensure your observability data stays exactly where you need it.
End-to-end encryption
Data encrypted in transit and at rest. Protected from your infrastructure to our storage — and automatically deleted when you're done.
RBAC
Fine-grained access control for every team member. Set permissions, track access, maintain complete audit trails.