coding agents
welcome
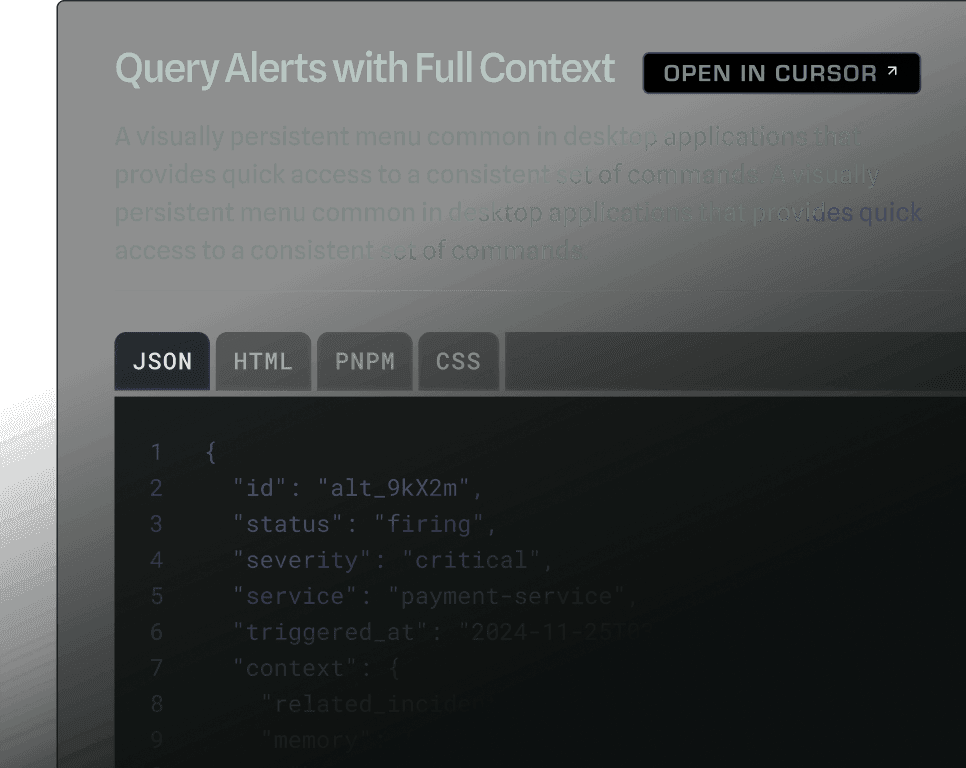
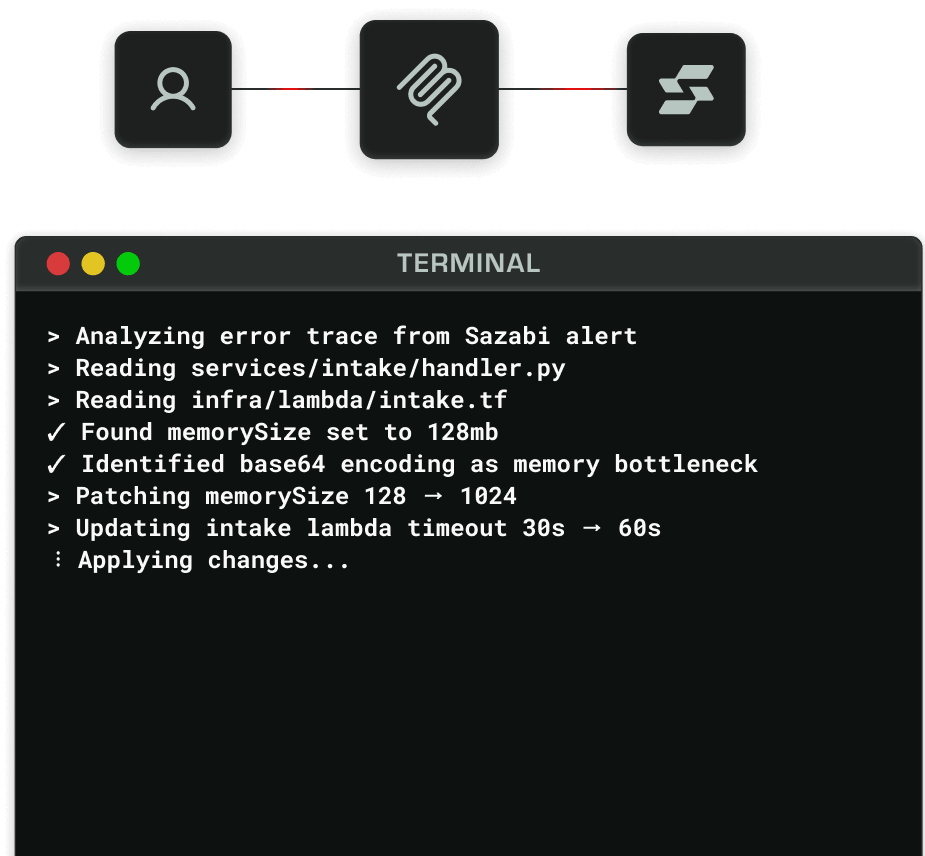
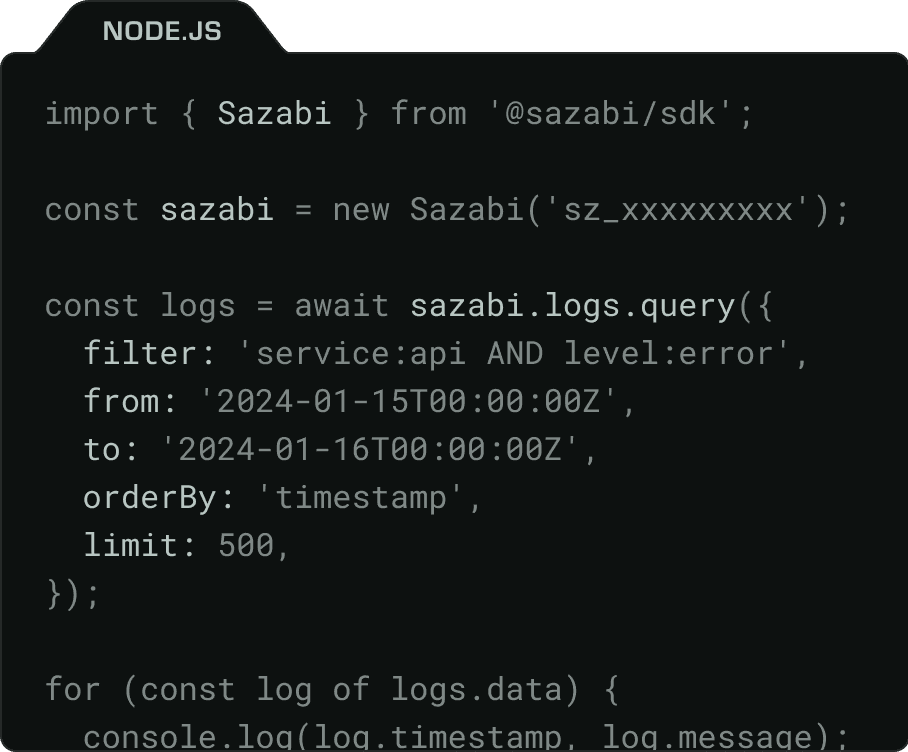
Observability for AI, not just humans. Claude Code, Cursor, and every major coding agent can investigate production, trace errors, and debug live systems through native integrations.
SazabiAPP9:18 AM
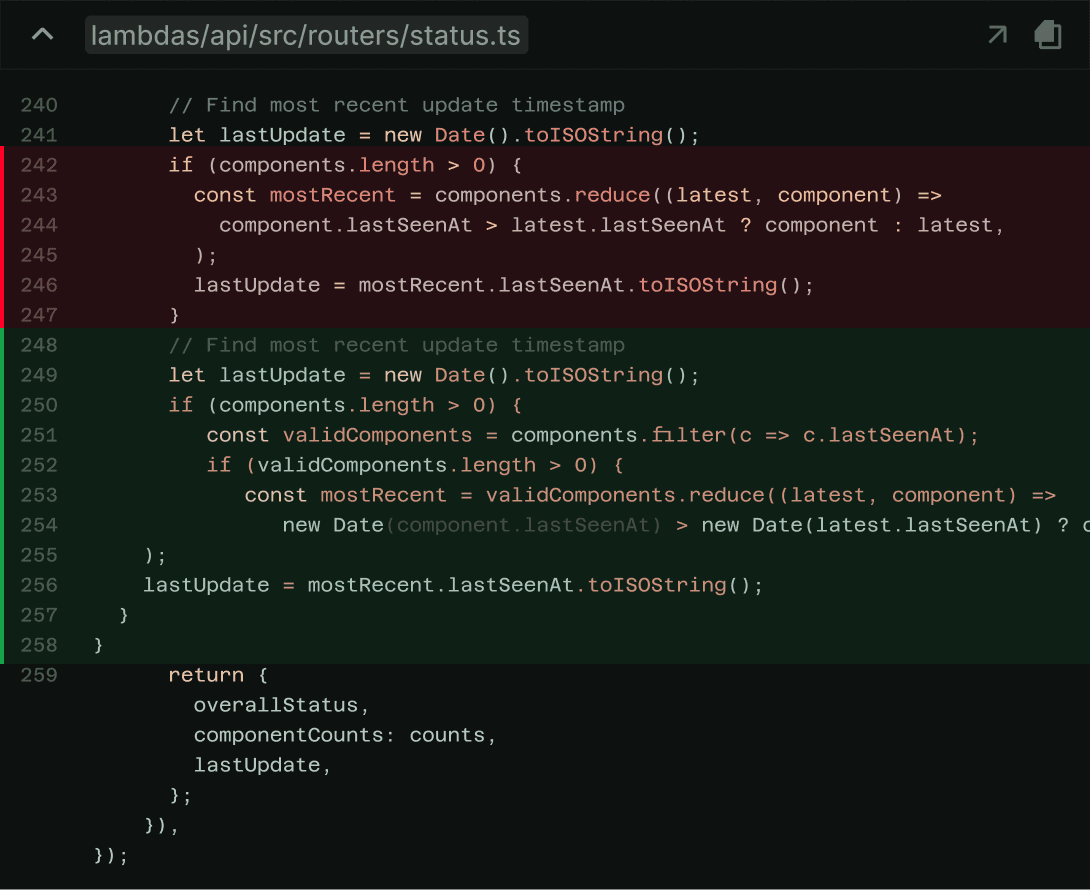
fix: increase API lambda timeout Error fixed using @Claude Code@Claude Code
All agents supported